
If your GPU is running hotter than usual, dropping FPS, crashing, or showing strange artifacts, don’t assume it’s dying just yet. I’ll show you how to check GPU health using free Windows tools, monitoring software, and safe stress tests.
You’ll learn how to check your GPU’s temperature, hotspot, VRAM, power draw, driver status, and stability, plus which warning signs actually matter.
I’ll also show you how to check a used GPU before buying it and how often I’d recommend checking your GPU to catch problems before they turn into expensive repairs.
TL:DR
The quickest way to check GPU health is to monitor temperature and usage in Task Manager, check for driver errors in Device Manager, then use HWiNFO or GPU-Z for detailed sensor readings. If you suspect a hardware problem, run a short FurMark or OCCT stress test while watching temperatures and visual stability.
What Does GPU Health Actually Mean?
“GPU health” isn’t one number — it’s a combination of stable temperatures, consistent frame delivery, and a driver that isn’t throwing errors. When one of those starts slipping, that’s your early signal, well before anything fails outright.
What a Healthy GPU Looks Like?
A GPU in good shape idles cool, holds its clock speeds under load, and produces a clean, artifact-free image game after game. Confirming this takes a couple of quick checks rather than a single test.
What to expect:
- Stable frame rates that match what the card is rated for at your settings
- Temperatures that plateau under load instead of climbing indefinitely
- No error codes in Device Manager or DxDiag
- A driver that hasn’t crashed or reset itself recently
What Warnings You Should Not Ignore?
Most GPU problems announce themselves well before the card actually fails, which is exactly why a quick health check is worth the five minutes. These symptoms are worth investigating the same day you notice them.
Watch for:
- Random crashes during gaming or video export
- Screen artifacts — pink or green squares, checkerboard patterns, flickering textures
- FPS drops that weren’t there a few weeks ago
- Black screens that flash and then recover
- Fans ramping up loud during light desktop use
- A faint, high-pitched buzz from the card under load (coil whine)
- Blue screens referencing a display driver (commonly nvlddmkm.sys or atikmpag.sys)
What is GPU VRAM Health?
VRAM problems show up as texture stuttering, missing textures, or crashes specific to memory-heavy games — distinct from a general thermal or driver issue. OCCT’s dedicated VRAM test writes and reads memory cells under load to catch unstable sectors that a basic stress test won’t isolate.
How to Check GPU health with Windows’ built-in tools?
Before installing anything, Windows already has three tools that cover the basics. They’re free, already installed, and each takes under two minutes.
Task Manager
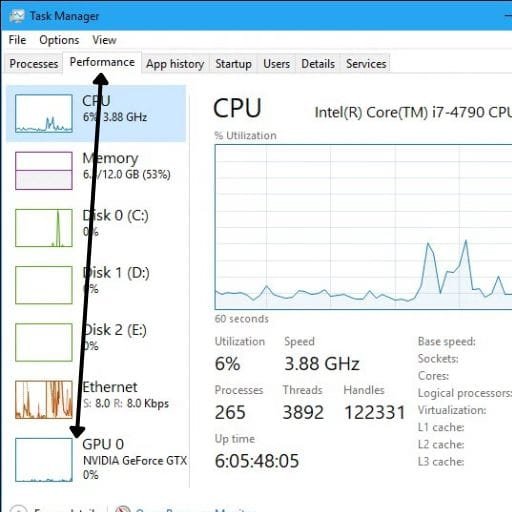
Task Manager is the fastest way to check GPU health without installing anything. Press Ctrl + Shift + Esc, open the Performance tab, and select your GPU from the left sidebar to see live usage, memory, and temperature.
Best for:
- A quick sanity check while a game or app is running
- Spotting a GPU pegged at 100% during light tasks, which points to a background process or driver issue
Caveats:
- Not every GPU reports temperature here — older cards and some laptop chips may show a blank reading
- It won’t catch problems that only appear under sustained heavy load
Device Manager
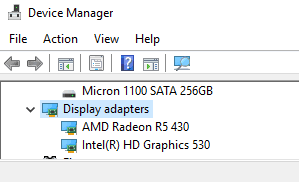
Device Manager confirms whether Windows and the driver see your GPU as functioning normally. Press Windows + X, open Device Manager, expand Display Adapters, right-click your GPU, and check Properties.
Best for:
- Confirming there’s no driver conflict or missing driver
- A first stop if your display suddenly looks wrong or a game won’t launch
Issues:
- “This device is working properly” only confirms driver communication, not thermal or performance health
- An error code here (commonly Code 43 or Code 12) points to a real problem and is worth searching by its exact code
DirectX Diagnostic Tool (DxDiag)
DxDiag gives a fuller snapshot of your GPU’s hardware and driver state in one screen. Press Windows + R, type dxdiag, hit Enter, then open the Display tab.
Best for:
- Confirming your driver version and DirectX feature level at a glance
- A single place to check before contacting support or posting in a forum, since it summarizes what they’ll ask for anyway
Caveats:
- “No problems found” means DirectX didn’t detect an obvious conflict — it isn’t a thermal or stability test
- If you see a problem listed, note the exact wording before searching for a fix
How to Check GPU Health with Dedicated Monitoring Software?
Built-in tools confirm the basics, but they don’t show what’s happening at the sensor level — hotspot temperature, power draw, or whether the card is throttling.
How To Check Health With GPUs’ Manufacturer Apps?
Your GPU’s own manufacturer app is the simplest starting point since it’s built specifically for your hardware and installs alongside the driver. Each one now bundles basic monitoring, driver updates, and per-game settings in a single interface.
Best for:
- NVIDIA cards: the NVIDIA App (GeForce Experience is legacy and no longer receiving updates)
- AMD cards: AMD Software: Adrenalin Edition, which includes a built-in performance overlay
- Intel Arc cards: Intel Graphics Software, which replaced Arc Control in late 2024
Problems:
- These apps report the basics well but go less deep on sensor data than dedicated monitoring tools
- If your driver install still shows the old app name, a reinstall from the manufacturer’s site will pull the current version
Which Third-Party Monitoring Tools to Use?
For anything beyond the basics — hotspot temperature, VRAM temperature, power limit throttling — a dedicated monitoring tool reads sensor data the manufacturer apps don’t always surface.
Best for:
- HWiNFO: the deepest sensor breakdown, including whether the GPU is power-limited, thermal-limited, or voltage-limited
- GPU-Z: a fast, lightweight snapshot of your card’s specs, BIOS version, and current sensor readings
- MSI Afterburner: an on-screen overlay for monitoring temps, clocks, and fan speed live while you play, regardless of GPU brand
I recommend you use afterburner because it gives more options for GPU settings.
| Tool | Best for | Cost | Works with |
|---|---|---|---|
| HWiNFO | Deep sensor logging and throttle diagnosis | Free | NVIDIA, AMD, Intel |
| GPU-Z | Quick spec and sensor snapshot | Free | NVIDIA, AMD, Intel |
| MSI Afterburner | Real-time in-game overlay | Free | NVIDIA, AMD, Intel |
| Tool | Pros | Cons |
|---|---|---|
| HWiNFO | Most detailed sensor data; logs to file for later review | Dense interface can overwhelm first-time users |
| GPU-Z | Lightweight; opens in seconds; easy to screenshot for forum help | Less depth on sustained logging over time |
| MSI Afterburner | Works as an in-game overlay; adjustable fan curves | Overlay setup takes an extra step in newer Windows versions |
What is Core Temp vs Hotspot Temp vs Memory Junction Temp?
Here’s something most guides skip: modern GPUs report three separate temperatures, and checking only one gives an incomplete picture.
What each number means:
- Core temp — the average die temperature; this is what most basic tools show by default
- Hotspot temp — the single hottest point on the die, typically 10–20°C above core temp on a healthy card; a gap wider than 20°C often points to a thermal paste or pad problem
- Memory junction temp — the VRAM chips’ own temperature, which matters most on cards with 12GB+ of memory doing sustained heavy workloads
HWiNFO and GPU-Z both surface all three. If your hotspot or memory temp is climbing much faster than core temp, that’s a more specific lead than a single overall number would give you.
How to Stress-Test Your GPU Safely?
A stress test pushes your GPU to 100% load so problems that only show up under heavy use — overheating, artifacts, driver crashes — surface in minutes instead of during your next long gaming session.
Running a FurMark stress test
FurMark is a popular tool for this. Install it, choose the GL test (not the benchmark), pick your resolution and GPU, and run the stress test.
Best for:
- Confirming stability under a worst-case sustained load
- Isolating whether a problem is heat-related or something else
Problems:
- FurMark’s load pattern is heavier than most games, so treat it as a stress test, not a real-world FPS predictor
- Run it for 10–15 minutes minimum — a card can look fine for the first few minutes and still show problems later
What to Watch for During the Test?
While the test runs, three things matter more than the FPS counter: temperature, power draw, and visual stability. Any one of them going wrong tells you something specific about what to check next.
What each sign points to:
- Temperature climbing past your GPU’s rated max (check the manufacturer’s spec sheet for your exact model) — cooling or dust buildup
- Sudden crash or shutdown — often the power supply, not the GPU itself; confirm your PSU wattage has headroom above the GPU’s recommended spec
- Artifacts, flickering, or a hard freeze — stop the test immediately; this is the least ambiguous sign of a hardware problem
OCCT: combined testing, auto-stop, and coil whine detection
OCCT is worth running alongside or instead of FurMark, especially for two features FurMark doesn’t have. It can run GPU, VRAM, and power tests together, and its current version includes a coil whine detection mode that deliberately varies GPU load in a pattern to make coil whine audible and easier to isolate from normal fan noise.
Best for:
- Combined GPU + power supply testing in one pass
- Automatically stopping the test the moment it detects an error, instead of you having to watch the whole run
- Confirming coil whine is coming from the GPU specifically, not another component
Caveats:
- A passed stress test is a strong signal, not a guarantee — some issues only appear in specific games or after multi-hour sessions
Safe GPU temperature ranges
| Condition | Safe range | Warning zone |
|---|---|---|
| Desktop GPU, idle | 30–45°C | Above 55°C |
| Desktop GPU, under load | 60–80°C | Above 85°C |
| Laptop GPU, idle | 40–55°C | Above 65°C |
| Laptop GPU, under load | 75–88°C | Above 90°C |
| Stress test (desktop) | Up to 85°C | Sustained above 85°C |
| Stress test (laptop) | Up to 90°C, short duration | Above 90°C |
Laptops run hotter by design — tighter chassis, smaller heatsinks, and less airflow mean idle and load temps both sit several degrees above a desktop with the same GPU silicon. Treat laptop numbers on this table as normal, not alarming, unless they’re sustained above the warning line.
Common GPU health problems and How to Fix Them?
Most of what looks like a dying GPU turns out to be a driver, dust, or power issue instead. Here’s how to tell the difference.
Crashes only in specific games Usually a driver conflict or corrupted shader cache, not failing hardware. Update to the latest driver from your GPU brand’s site; if problems persist, use Display Driver Uninstaller (DDU) to remove the old driver completely before a fresh install.
Black screen that recovers on its own (TDR error) Windows detected the GPU stop responding and restarted the display driver. Common causes are overheating, an unstable overclock, or a failing card. Check temperatures in HWiNFO while gaming — if they’re climbing past your card’s rated max, clean out dust and confirm the PCIe power cables are fully seated.
Screen artifacts (shapes, colors, or lines) This can come from overheating, VRAM failure, driver corruption, or aging hardware. Update drivers with a clean DDU install first, then run a stress test with temperature monitoring, then an OCCT VRAM test. If artifacts persist after all three, the hardware itself is the likely cause.
FPS noticeably lower than a few months ago Usually thermal throttling — the GPU is lowering its own clock speed to stay within its temperature limit. Clean the fans and heatsink, and if the card is 3+ years old, consider that the thermal paste may need replacing.
A faint whining or buzzing noise under load This is coil whine — an electrical hum from the card’s power components, not a fan. It’s common and rarely a defect, but if it’s new, louder than before, or paired with instability, run OCCT’s coil whine test to confirm the source before assuming it’s normal.
Fans not spinning at idle Many modern cards use a zero-RPM mode that stops fans entirely when idle and cool — this is normal and by design. If fans stay off during gaming or a stress test, that’s an actual fan failure worth addressing.
How to Check GPU Health on a Used or Second-Hand Card?
- Run GPU-Z and check the BIOS version and manufacturing date against what the listing claims
- Run an OCCT VRAM test for at least 20 minutes — sustained heavy use is the scenario most likely to degrade memory cells
- Check fan bearings by ear during a stress test; grinding or rattling is a sign of wear a temperature check won’t catch
- Ask the seller directly whether the card was used for mining; a straight answer plus a clean stress test result is a reasonable bar for a used purchase
A 5-minute Monthly GPU Health Checklist
Checking GPU health doesn’t need to be a full stress-test session every time. A short routine once a month catches most problems long before they become expensive.
- Open Task Manager during a game session and glance at usage and temperature
- Check Device Manager for any new warning icons
- Confirm your GPU driver is current through the NVIDIA App, AMD Software, or Intel Graphics Software
- Listen for any new noise — grinding fans or coil whine that wasn’t there before
- Once a quarter, run a 15-minute FurMark or OCCT session and compare temperatures to your last check
How to Improve and Maintain GPU Health Over Time?
Prevention does more for a GPU’s lifespan than any single check. A few habits make the biggest difference:
- Clean the card every 3–6 months. Dust blocking the heatsink fins and fans is the single most common cause of rising temperatures over time.
- Keep drivers current, but check user feedback before installing a brand-new release — occasional regressions happen, and it’s worth knowing you can roll back if needed.
- Confirm your power supply has headroom. A GPU running near a PSU’s rated limit is more likely to cause instability under load.
- Give the case room to breathe. Closed cabinets and carpet placement both restrict airflow that the GPU depends on.
- Consider a repaste after 3–5 years on an otherwise healthy card showing climbing temperatures — this is an intermediate DIY job, so look up a guide specific to your model first.
Beyond the GPU itself, a lot of perceived “GPU problems” are really system-level bottlenecks. If your GPU checks out clean but performance still feels off, it’s worth working through how to optimize your PC for gaming next.
Gamers Also Ask About GPU Health
A quick Task Manager glance every few weeks is enough for most people. Run a full 15-minute stress test every two to three months, or any time you notice a real change in performance or noise.
HWiNFO gives the most detailed sensor data, MSI Afterburner is best for live in-game monitoring, GPU-Z is fastest for a quick snapshot, and OCCT or FurMark cover stress testing.
Yes. A passed test is a strong signal, not a guarantee — some issues only surface in specific games, after multi-hour sessions, or under a driver configuration a synthetic test doesn’t replicate.
Yes, for a healthy card with adequate cooling. Monitor temperatures throughout, keep sessions to 15–20 minutes for a routine check, and stop immediately if you see artifacts or temperatures approaching your card’s rated max.
No. Physical damage, a failing capacitor, or a mechanical fan issue needs a hands-on look. Software is reliable for catching thermal, driver, and performance-level problems, but it can’t replace a physical inspection.
Is GPU Health Worth Checking?
Yes, I would recommend checking your GPU health at least once every three months. It only takes a few minutes, but it can help you catch rising temperatures, cooling problems, VRAM errors, driver issues, or other signs of hardware trouble before they become serious.
Leaving your GPU unchecked for years can mean missing problems that gradually reduce gaming performance or put unnecessary stress on the hardware. In the worst case, overheating or a failing component can lead to an expensive repair — or leave you needing to replace the GPU altogether.
You don’t need to stress-test it every month. For most gamers, a quick health check every three months, combined with checking temperatures whenever you notice unusual crashes, artifacts, noise, or FPS drops, is a sensible routine.
